
Amongst a mini-blizzard of reports and opinions on reforms to the nation’s tertiary education system, both in higher education (HE) and especially the VET sector, the KPMG report Reimagining tertiary education: from binary system to ecosystem is commendable by going beyond analysis and proposing reforms. Universities Australia agrees with its broad diagnosis but strongly rejects the cure.
The KPMG report has 10 recommendations, making clear the first is likely the hardest and fundamental to all others, being that by negotiation with states and territories (S&T) the Australian Government over time takes primary responsibility for a single tertiary education funding framework across all AQF levels. The trend decline in public funding for VET relative to its growth in schools and universities has been graphically exposed by the Mitchell Institute. What’s not been explained is the confluence of policy decisions collectively driving this decline in VET funding. Funding outcomes especially in the period 2012–16 as shown in figure 1 help explain the year by year changes.
Figure 1- ‘Revenues from government’ funding source
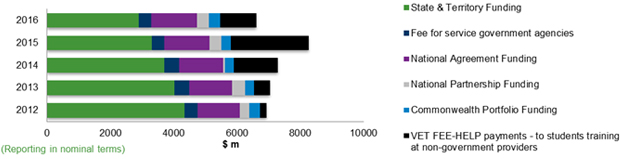
Note: Reporting does not include capital revenue.
Fee for service government agencies – include revenues received directly from Australian and state and territory government departments, generally on a tendering/bidding basis. Tendering/bidding would generally involve shorter-term, individual project/course-specific contracts, arrangements and payments. Source: NCVER Financial Information 2016, pg 8.
The major contributions to VET funding are ‘revenues from government’ being S&T revenues and those of the National Agreement for Skills and Workforce Development (NASWD) set up in 2009 under the Intergovernmental Agreement on Federal Financial Relations, being funds from the Commonwealth of Australia (Commonwealth). Using 2009 as base year, the then contribution split (S&T funds vs NASWD funds) was 74.0 per cent S&T and 26.0 per cent NASWD. By 2016 the split was 66.5 per cent and 33.5 per cent respectively. In 2016, had the S&T ‘maintained’ their proportionate ‘74:26’ share they would have invested collectively (on a nominal basis) about $1.24 billion more in 2016 than they did. Assuming the same base year, over the multi-year period 2009–16, the S&T ‘proportionate gap’ in funding (in nominal terms) is less, being about $1.18 billion. The reason this is less than 2016 alone is that for part of the earlier period, being 2009–12, some S&T revenues exceeded the ‘74:26’ ‘benchmark’ ratio, especially by larger jurisdictions.
This emphasises jurisdictional differences. The size of S&T VET systems is very wide ranging. Some jurisdictions have stayed closer or exceeded in any year the ‘74:26’ split over 2009–16 and others, particularly the larger more populous jurisdictions have shown greater fluctuation. Critically, jurisdictions recently show significant funding declines, especially from 2012 onwards. Hence the national picture in figure 1. Why is this so? There are five potential contributing reasons.
1. The NASWD had no ‘maintenance of proportional funding effort’ obligations; it’s not a contract but rather an agreement that is in effect unenforceable and where no parties are held accountable. So the annual Report on Government Services retrospectively and benignly shows graphically that NASWD targets are not even close to being on track and show negative change. To the Commonwealth’s credit, they have stuck by NASWD’s terms, indexing contributions at ~ 1.4 per cent each year (no HE-style two-year funding freeze). The NASWD funding is over $1.5 billion 2018/19. There was no indexing requirement for S&T funds.
2. The smaller National Partnership on Skills Reform (NPSR) (figure 1) injected more Commonwealth funding starting in 2012. It was a ‘reform’ agreement of about $1.75 billion over 5 years (2012/13 to 2016/17), variable each year and on average about $350 million p.a. The early years and bulk of funds were for ‘structural reforms’ to push TAFEs into greater arms-length governance from governments (some TAFEs notably in Victoria were mostly there already) as well as driving VET market ‘efficiency, responsiveness, quality, transparency’ reforms supporting ‘public providers to operate effectively in an environment of greater competition’. The funding in the later years of the NPSR was predominantly for VET training. All this pushed more Commonwealth funds into S&T systems. With the closure of the NPSR in sight by 2017, there was a flurry of political and stakeholder agitation to renew it. Belatedly a new national partnership, the Skilling Australians Fund, emerged but only some jurisdictions have so far signed on.
3. The NPSR helped unleash the VET FEE HELP ‘finance bubble’. The program was uncoupled from direct links to a HE articulation pathway. This change installed HE-style financing for VET diplomas and above, but precipitated dire training quality, rorting of students and collateral reputational harm for the sector, caused by a small group of rogue providers, inept program management and ineffective regulation. The program was closed at the end of 2016. The Commonwealth are now far more prudent investors in VET diplomas, financed under VET Student Loans, so re-affirming the Commonwealth’s ongoing financing of higher level VET qualifications.
4. ‘Demand driven’ funding for HE revved up before and took off beyond 2012. University participation has climbed steadily. The Australian Government Treasury bought into (perhaps until recently) the principle of ‘demand driven’ funding, but S&T treasuries never bought into demand driven ‘VET entitlements’ (the language of training post the Global Financial Crisis). The flow on consequences are profound. It has tilted student demand to universities, institutions that carry the prestige, marketing and funding capacity to enrol students, subject to entry standards, at Bachelor level and fed by sub-bachelor entries. Universities have ‘self-accreditation’ status and curriculum agility when working with industry, whereas registered training organisation (RTOs) are anchored on training packages qualifications and accredited courses approved by regulators. Policy to extend the HE ‘demand driven’ system to HE sub-bachelor programs whilst not pursued, was endorsed by Universities Australia (UA). In response to Business Council of Australia’s Future Proof proposals, UA proposed universities partner with industry to (inter alia) ‘jointly develop higher-end vocational programs in higher education; co-invest with universities in quality work placements, including internships; and increase the number of apprenticeships offered by business and industry’. This is mostly traditional VET terrain.
State and regional economic development increasingly values local universities as being central to supply of skilled graduates. In fast evolving labour markets, employers have equally high expectations of discipline knowledge and technical skills in employees, as well as wanting enterprise capabilities in graduates. Besides Ministers of Training, S&T Cabinets may also include Ministers for Higher/International Education, Science and Innovation and the like. This helps reinforce arguments that future labour market demand will be increasingly met by university graduate supply. Some universities are unambiguous in promoting both their educational and vocational credentials in aligning courses to future jobs. Universities have not yet entered into the core VET domain of trades and apprentices, other than on a small trial basis. All this risks eroding and underselling the role and value of VET. Nevertheless, S&Ts are also well aware that increased university places are funded by the Commonwealth, and that these graduates increasingly encompass vocational credentials.
5. The knowledge gained from the full VET market capture of all VET activities regardless of fund source (with now four years of Total VET Activity data) highlights that Commonwealth or state funded VET subject enrolments represent ~46.3 per cent of all subject enrolments in 2017, with fee-for-service 53.7 per cent. Governments have been keen to know what they might not need to fund, or fund less.
In summary, cost shifting may not be formal treasury language, but given S&T priorities like health, schools, policing and welfare, and that VET is funded under a federated system, there is a big chance VET will be pushed lower in priority given the above. So whilst S&T governments may make new funded VET policy announcements, in the end treasuries extract efficiency dividends. S&T Training Ministers of all colours face unenviable circumstances in managing the politics and quality of VET provision by best balancing TAFE vs private RTO contribution. Training is ‘demand managed’ with scarce public funds best aligned to current and future job openings. Governments have modest intelligence tools to do this, so shooting ‘time delayed arrows’ at fast moving ‘job market targets’ means they don’t always get it right, based on the view of one state auditor-general.
The NPSR was intended to encourage contestability and improve efficiency in quality VET provision. Efficiency improved for a while but recent recurrent expenditure per annual hour has now risen in 2015 and 2016. Whilst it is predicted that S&T VET funding will marginally increase in 2017, all trend data for government-funded student activity is down. In 2017 it shows a 5.9 per cent decrease in student numbers from 2016. Costs in delivering quality training must over time go up and government-funded training output is falling. The ‘do more with less’ arguments have now run thin.
So, circling back to Recommendation 1 in the KPMG Report. Any dialogue between governments on these matters would be pivotal to change. The bulk of VET training funds are presently split about ~2/3s S&T revenue to 1/3 NASWD (figure 1). Lesser but other significant resources include VET Student Loans for Diplomas (~$200 million in provider payments 2017), income from visas to part cover the Skilling Australians Fund (total budget ~$300 million 2017/18, and for which S&Ts must invest matching funds in agreed projects); plus quite separately; the Commonwealth invests in the apprentice support network and incentives programs (~ $580 million in 2017/18).
Finally, KPMG’s suggestion to allow access to income contingent loans for all level of the AQF is to be cautioned. There are outright social equity concerns as Certificate III is not much higher than school-level. This certificate is the lowest ‘safe-ledge’ for early job-seekers in any qualification ‘climb’, so loans only above this level might be justified. The second reason is the overall numbers. There are about 4.2 million participants in the national VET system, the bulk (53 per cent) are studying at Certificate III and below. The nation’s HELP debt is already stretched with growing concerns about its sustainability, even though new lower threshold repayment measures have just been legislated.
Dr Craig Fowler is an analyst and observer of national policies impacting tertiary education, science and innovation after decades of experience in private, public and university sectors.
Do you have an idea for a story?Email [email protected]

Get the news delivered straight to your inbox
Receive the top stories in our weekly newsletter Sign up now